SEM/EDS: Análisis de Fallos y Causa Raíz de Contaminación para Fabricación Aditiva
Introducción: Rastreando a los Culpables en el Mundo Microscópico – Cómo SEM/EDS Resuelve los Rompecabezas de Fallos y Contaminación en la Impresión 3D
En el campo de la fabricación aditiva de metales, los fallos repentinos de las piezas o las fluctuaciones inexplicables del rendimiento suelen ser inesperados y disruptivos. Como ingenieros de análisis de fallos en Neway, entendemos que las causas raíz de estos problemas a menudo se encuentran en el mundo microscópico, más allá del alcance del ojo humano. Una inclusión de tamaño micrómetro, una grieta a nanoescala o un rastro inesperado de contaminación elemental pueden ser suficientes para causar el fallo funcional completo de una pieza. Para abordar estos desafíos, confiamos en la poderosa combinación del Microscopio Electrónico de Barrido (SEM) y la Espectroscopía de Energía Dispersiva (EDS). Como detectives, buscamos evidencia a micro y nanoescala, proporcionando explicaciones concluyentes de causa raíz para cada caso de fallo.
Descripción General de la Tecnología SEM/EDS: Visión Simultánea de Morfología y Composición
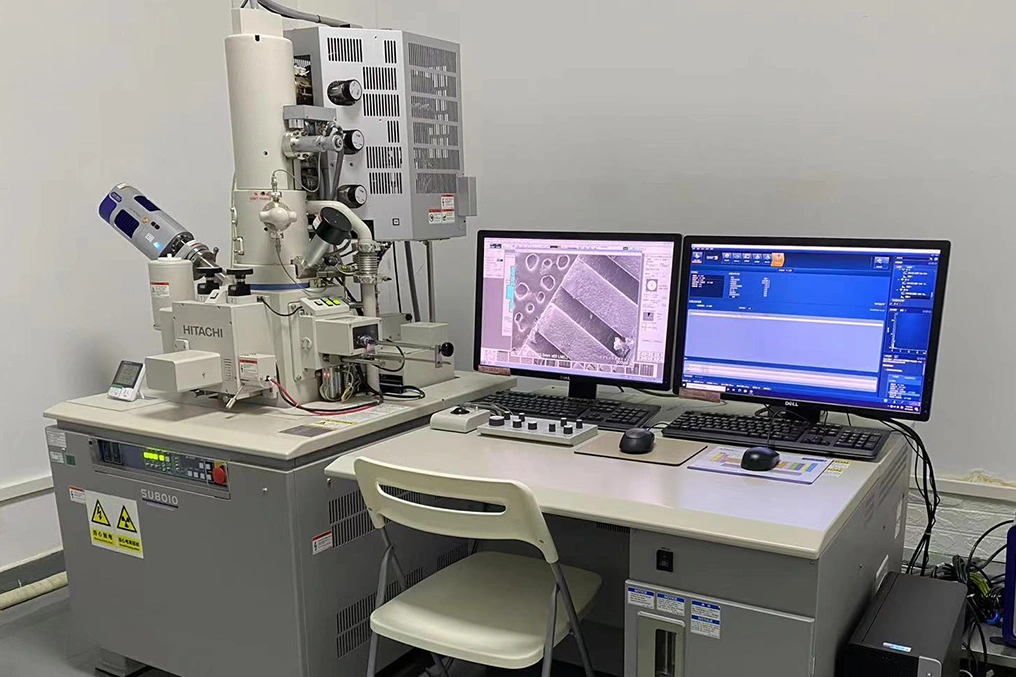
Microscopía Electrónica de Barrido: Imágenes de Ultra Alta Resolución Más Allá de los Límites Ópticos
El SEM utiliza un haz de electrones enfocado para escanear la superficie de la muestra, construyendo imágenes mediante la detección de electrones secundarios emitidos y electrones retrodispersados. En comparación con los microscopios ópticos convencionales, el SEM ofrece una resolución y profundidad de campo significativamente mayores, revelando claramente la morfología de fractura, las trayectorias de propagación de grietas, las estructuras de porosidad y otras microcaracterísticas. En nuestros análisis diarios, el SEM puede resolver fácilmente detalles de hasta 0.1 micrómetros, proporcionando evidencia visual sin precedentes para comprender los mecanismos de fallo del material.
Espectroscopía de Energía Dispersiva: Dando a las Microcaracterísticas una "Identificación Química"
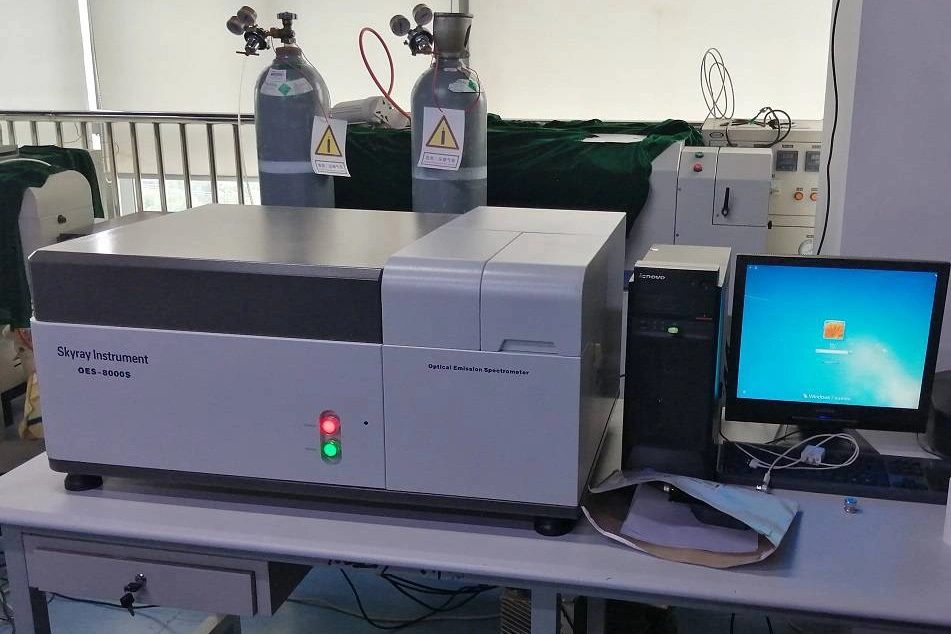
EDS es una técnica complementaria crucial para el SEM. Al detectar los rayos X característicos generados cuando el haz de electrones interactúa con la muestra, EDS proporciona un análisis cualitativo y semicuantitativo de la composición elemental en la región observada. Cada vez que identificamos características anormales bajo SEM, EDS puede revelar inmediatamente su composición elemental. Ya sean partículas extrañas, segregación o contaminación superficial, EDS proporciona a estas microcaracterísticas una precisa "tarjeta de identidad química".
Cómo Neway Utiliza SEM/EDS para el Análisis de Fallos y el Rastreo de Contaminación en Fabricación Aditiva
Fractografía: Descifrando el "Último Momento" de la Pieza
Una superficie de fractura es la "caja negra" que registra todo el proceso de fallo de una pieza. Al examinar las características de fractura con SEM, podemos determinar con precisión el modo de fallo. La fractura dúctil se caracteriza por hoyuelos, la fractura frágil por facetas de clivaje y la fractura por fatiga por marcas de playa y estrías distintivas. Con EDS, podemos analizar aún más la zona de iniciación de grietas para identificar posibles concentradores de tensión, como inclusiones, contaminación u otros microdefectos.
Identificación de la Fuente de Contaminación: Rastreando desde los Síntomas hasta la Raíz
A lo largo del flujo de trabajo de fabricación aditiva, la contaminación puede introducirse en múltiples etapas. Cuando se detecta un rendimiento anormal, se utiliza EDS para comparar la composición elemental de las regiones sospechosas con la del material base, ayudándonos a identificar la fuente de contaminación. Puede originarse por contaminación cruzada de polvos metálicos, partículas de desgaste del equipo de impresión o residuos químicos del postprocesado. Cada tipo de contaminación tiene una huella elemental única, lo que proporciona una base científica sólida para la trazabilidad.
Diagnóstico de Defectos del Proceso: Vinculando Anomalías Micro con Parámetros Macroscópicos del Proceso
SEM/EDS puede exponer directamente problemas en el proceso de impresión 3D. Por ejemplo, los defectos por falta de fusión aparecen bajo SEM como límites de partículas lisos y huecos distintivos, mientras que el efecto de bolas se manifiesta como grupos de partículas metálicas esféricas. La segregación elemental se revela mediante imágenes de electrones retrodispersados y mapeo EDS. Estas firmas microscópicas proporcionan una guía clara y cuantitativa para ajustar y optimizar el proceso.
Casos Típicos de Fallos y Contaminación en Fabricación Aditiva Analizados por SEM/EDS
Fallo Prematuro por Fatiga de Palas de Inconel 718 Aeroespacial
En un proyecto de motor aeroespacial, un lote de palas de turbina de Inconel 718 experimentó fallo prematuro por fatiga durante las pruebas. El examen SEM del origen de la fractura reveló inclusiones no metálicas anormales. El análisis EDS mostró que estas inclusiones eran ricas en aluminio y silicio, claramente diferentes de la composición de la aleación base. Una investigación más profunda rastreó la fuente hasta partículas de medios de chorreado que quedaron incrustadas durante el tratamiento superficial. Durante el posterior tratamiento térmico, estas partículas duras actuaron como concentradores de tensión, desencadenando la iniciación de grietas por fatiga.
Grietas Internas en Implantes Médicos de Ti-6Al-4V
En otro caso de dispositivo médico, se descubrieron grietas internas en un lote de implantes ortopédicos de Ti-6Al-4V durante la inspección final. Las observaciones SEM mostraron grietas propagándose a lo largo de los límites de grano β previos, indicando una grieta intergranular típica. EDS detectó un enriquecimiento anormal de cloro y potasio a lo largo de las trayectorias de las grietas. Estos hallazgos indicaron que la causa raíz eran los residuos de agentes de limpieza que contenían cloruro, que en condiciones específicas indujeron corrosión bajo tensión. Con base en esto, optimizamos el proceso de limpieza y eliminamos el problema.
Valor Central de SEM/EDS para la Producción y I+D en Fabricación Aditiva
El valor de SEM/EDS radica no solo en resolver problemas existentes, sino también en prevenir los futuros. A través de un análisis profundo de fallos, transformamos nuestro enfoque de una "corrección" pasiva a una "prevención" proactiva. Cuando surgen fluctuaciones de calidad en la producción, SEM/EDS puede identificar rápidamente la causa raíz, acortando significativamente los ciclos de resolución de problemas y reduciendo las pérdidas por tiempo de inactividad. Más importante aún, las ideas obtenidas de estos análisis respaldan directamente la optimización de procesos y el desarrollo de nuevos materiales, mejorando continuamente nuestras capacidades de fabricación aditiva.
Uso Colaborativo de SEM/EDS con Otras Tecnologías de Análisis
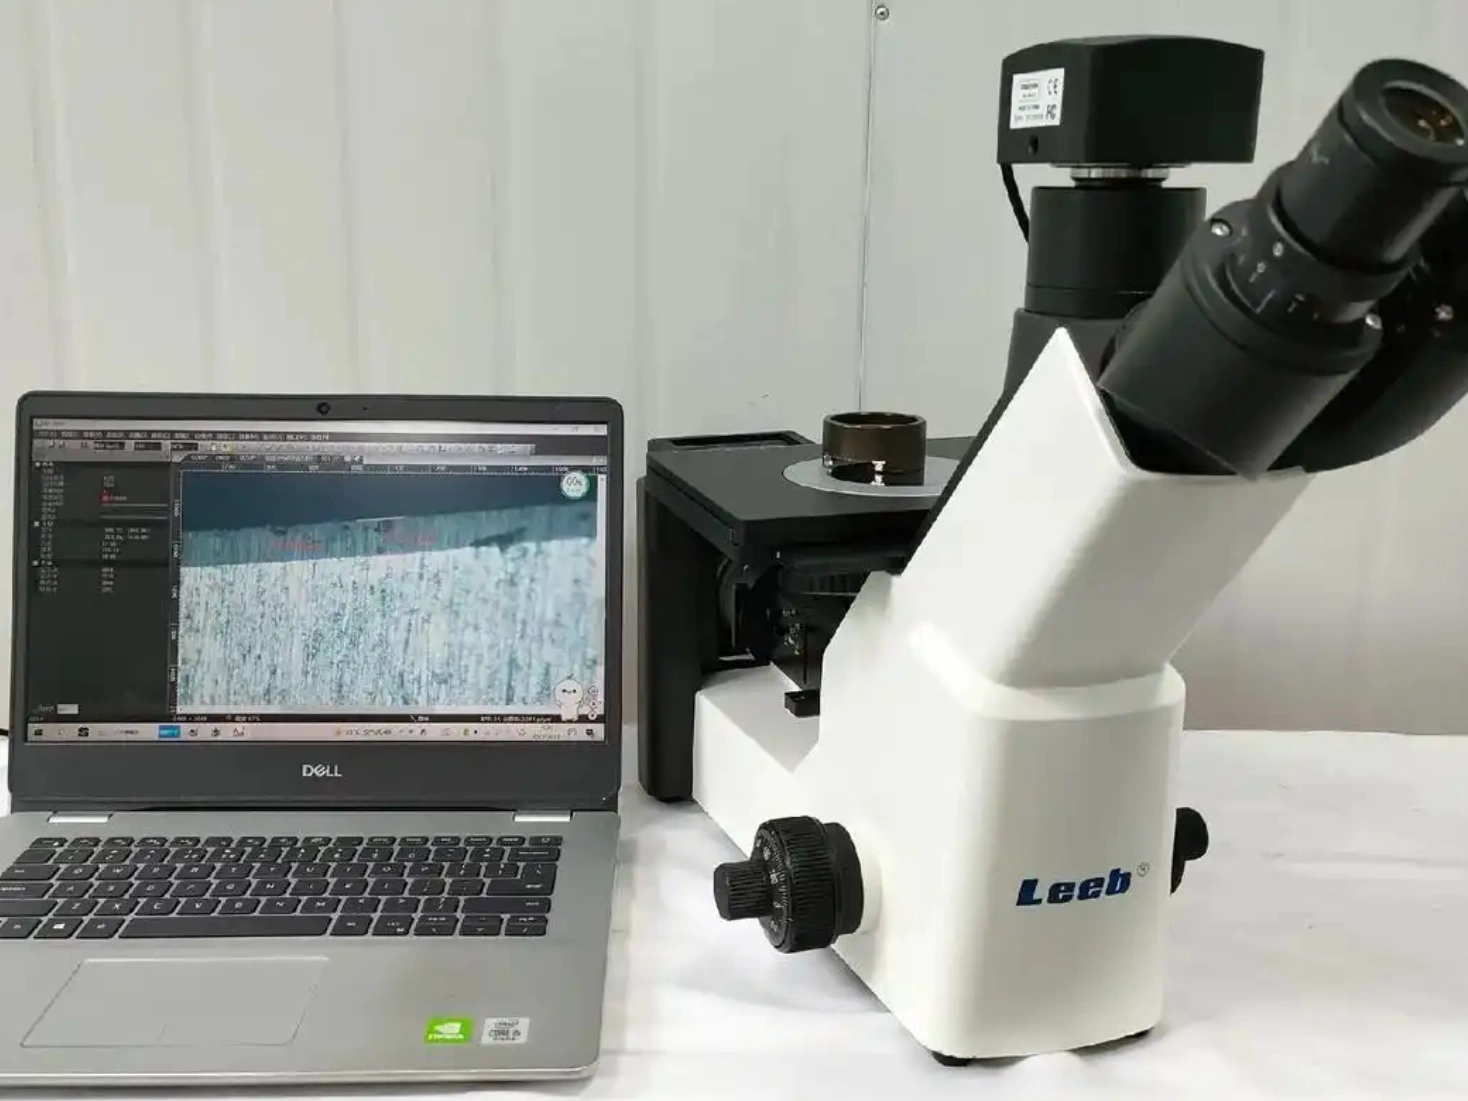
Análisis Escalonado con Microscopía Estereoscópica
En nuestro flujo de trabajo, el microscopio estereoscópico se utiliza a menudo como una herramienta de inspección de primera línea para localizar rápidamente regiones sospechosas y evaluar características a nivel macro. Luego se emplea SEM/EDS para un análisis de seguimiento de alta magnificación y alta resolución, proporcionando información morfológica y composicional detallada. Este enfoque escalonado de macro a micro garantiza tanto eficiencia como exhaustividad.
Complementariedad con el Análisis Metalográfico
El análisis metalográfico revela la distribución y morfología de los defectos dentro del material a granel mediante la preparación de secciones transversales, mientras que SEM/EDS puede usarse luego para realizar imágenes de mayor resolución y análisis elemental local en regiones específicas de interés. Juntas, estas técnicas proporcionan una imagen más completa de la microestructura y las características de los defectos.
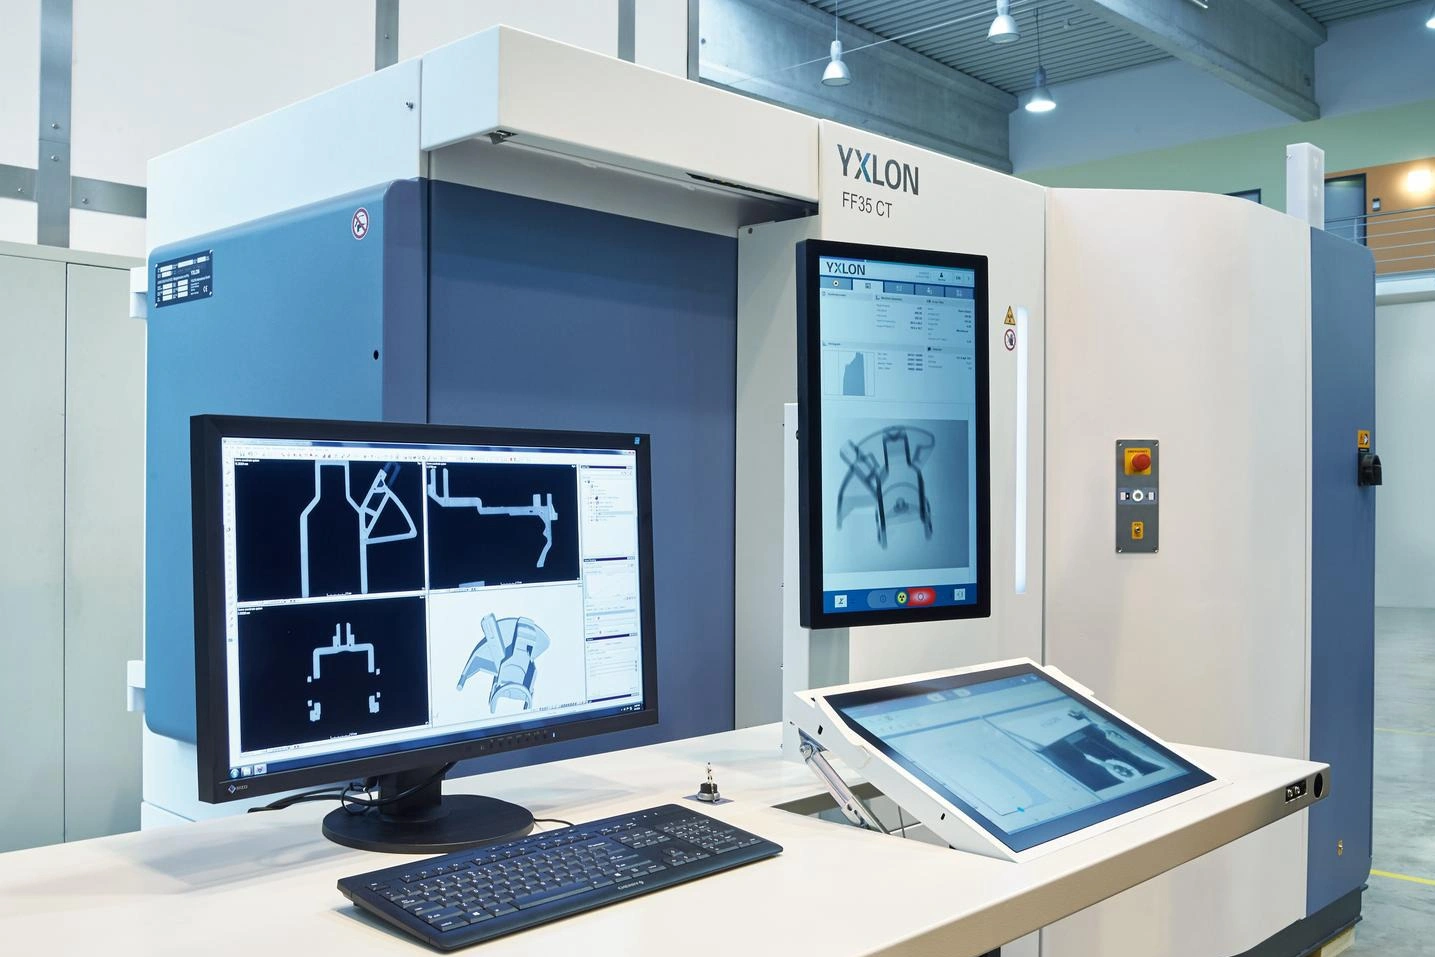
Integración con la Inspección de Defectos Internos
Cuando los rayos X o la TC industrial detectan defectos internos, SEM/EDS puede caracterizar aún más estas indicaciones en términos de micromorfología y composición química. Esta combinación de pruebas no destructivas para localización y análisis destructivo para caracterización forma una cadena analítica completa desde "dónde está el defecto" hasta "qué es el defecto".
Estudio de Caso: Cómo SEM/EDS Resolvió Problemas de Microporosidad por Lotes en Colectores de Acero Inoxidable
En un proyecto industrial, encontramos un problema desafiante: múltiples lotes de colectores de acero inoxidable 316L exhibieron microporos distribuidos aleatoriamente incluso después del prensado isostático en caliente (HIP), lo que provocó fugas durante las pruebas de presión.
Extrajimos muestras que contenían estos poros de las piezas fallidas y las preparamos cuidadosamente para la observación SEM. Las microfotografías revelaron paredes internas de poros inusualmente lisas, distintas de los defectos metalúrgicos típicos. El análisis EDS detectó niveles anormalmente altos de silicio y oxígeno en las superficies de los poros, con proporciones consistentes con el dióxido de silicio.
Basándonos en la morfología esférica de los poros y los datos composicionales, los identificamos como microesferas huecas de sílice. Un análisis de trazabilidad más profundo reveló que el problema se originó en el proceso del proveedor de polvo, donde los agentes formadores de escoria habían contaminado inadvertidamente el material durante el proceso de atomización. Cambiamos inmediatamente los lotes de polvo y endurecimos nuestros estándares de inspección de entrada, eliminando así este problema de calidad persistente.
Conclusión: Construyendo una Frontera de Calidad a Nanoescala – Transformando Cada Fracaso en un Paso Adelante
El análisis SEM/EDS juega un papel crucial en la resolución de los problemas de calidad más complejos y desafiantes en la fabricación aditiva. En Neway, nuestra inversión en estas capacidades analíticas avanzadas no se trata solo de fabricar piezas; se trata de ofrecer servicios completos y de alto nivel para la resolución de problemas. Cada caso de fallo es una oportunidad para que aprendamos y crezcamos. A través de un análisis científico riguroso, transformamos los fallos en impulsores de mejora continua. Invitamos sinceramente a los clientes que enfrentan problemas de calidad recurrentes o fallos repentinos a aprovechar nuestros servicios profesionales de análisis SEM/EDS y, juntos, construir una defensa de calidad robusta comenzando desde la nanoescala.
Preguntas Frecuentes
¿Cuáles son la resolución espacial típica y el tamaño mínimo de partícula detectable para SEM/EDS?
¿Cómo se deben preparar las muestras para SEM/EDS? ¿Es la preparación destructiva?
¿Cuánto tiempo suele llevar un análisis de fallos completo basado en SEM/EDS?
¿Pueden analizar elementos ligeros como carbono, oxígeno y nitrógeno? ¿Cuál es la precisión?
¿Proporcionan informes formales que incluyan todos los datos brutos e interpretaciones de expertos?