Can you provide formal reports with defect statistics, porosity evaluation color maps?
Formal Reporting with Advanced Defect Characterization
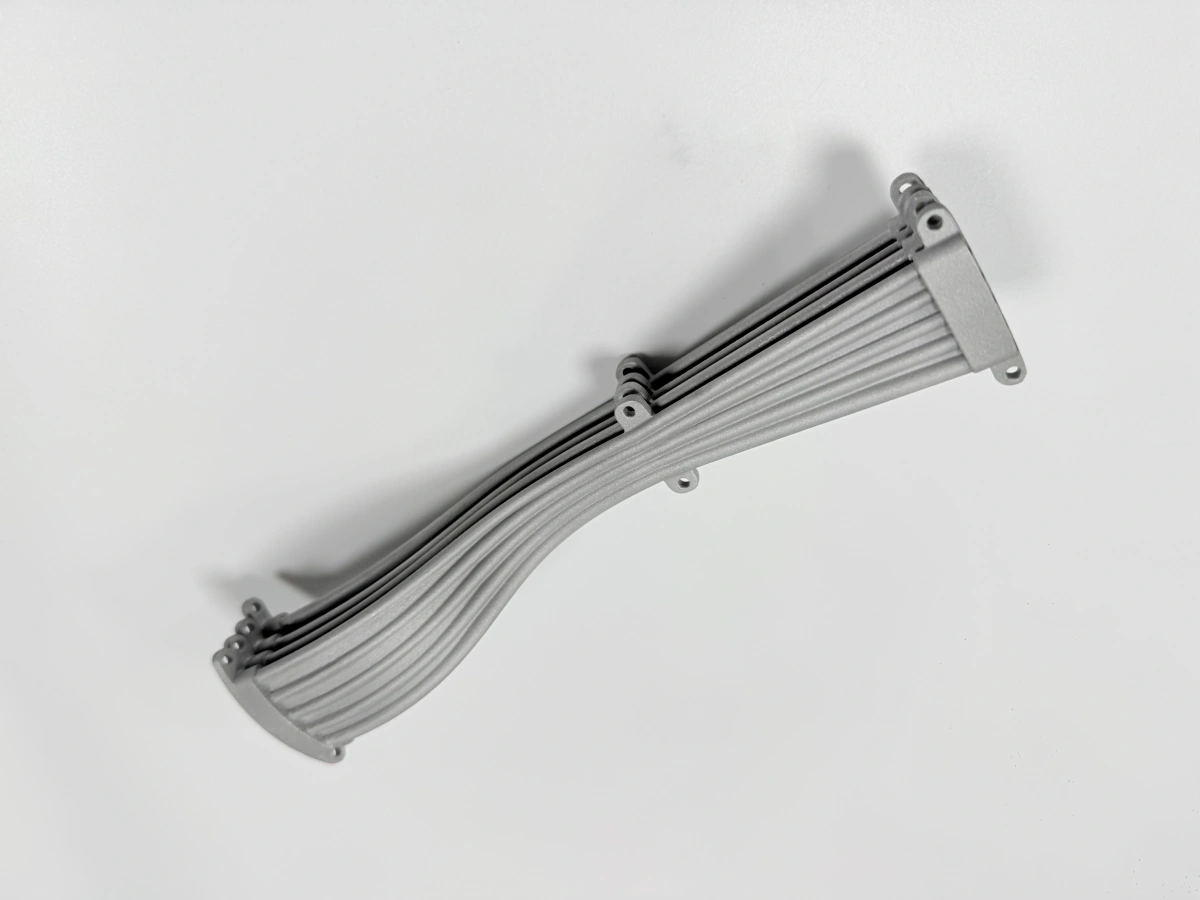
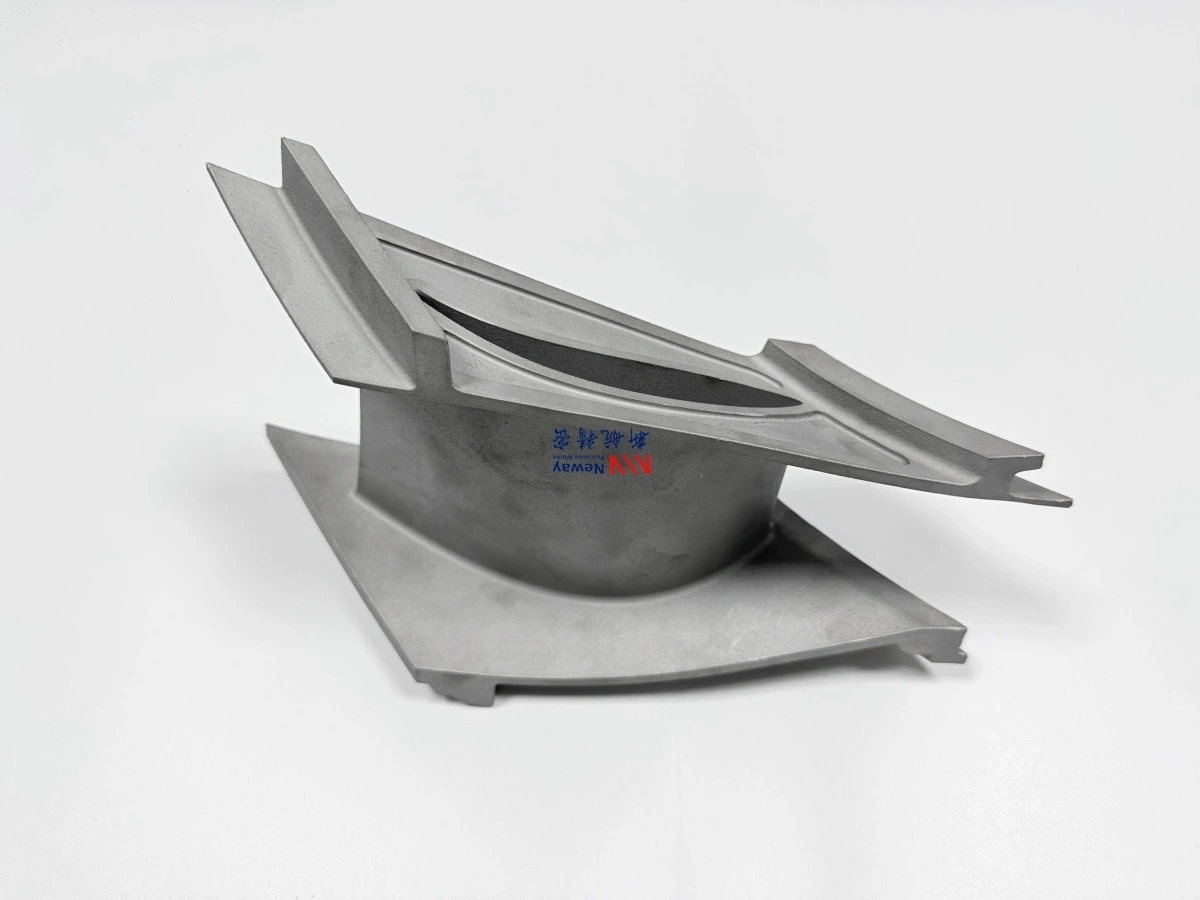
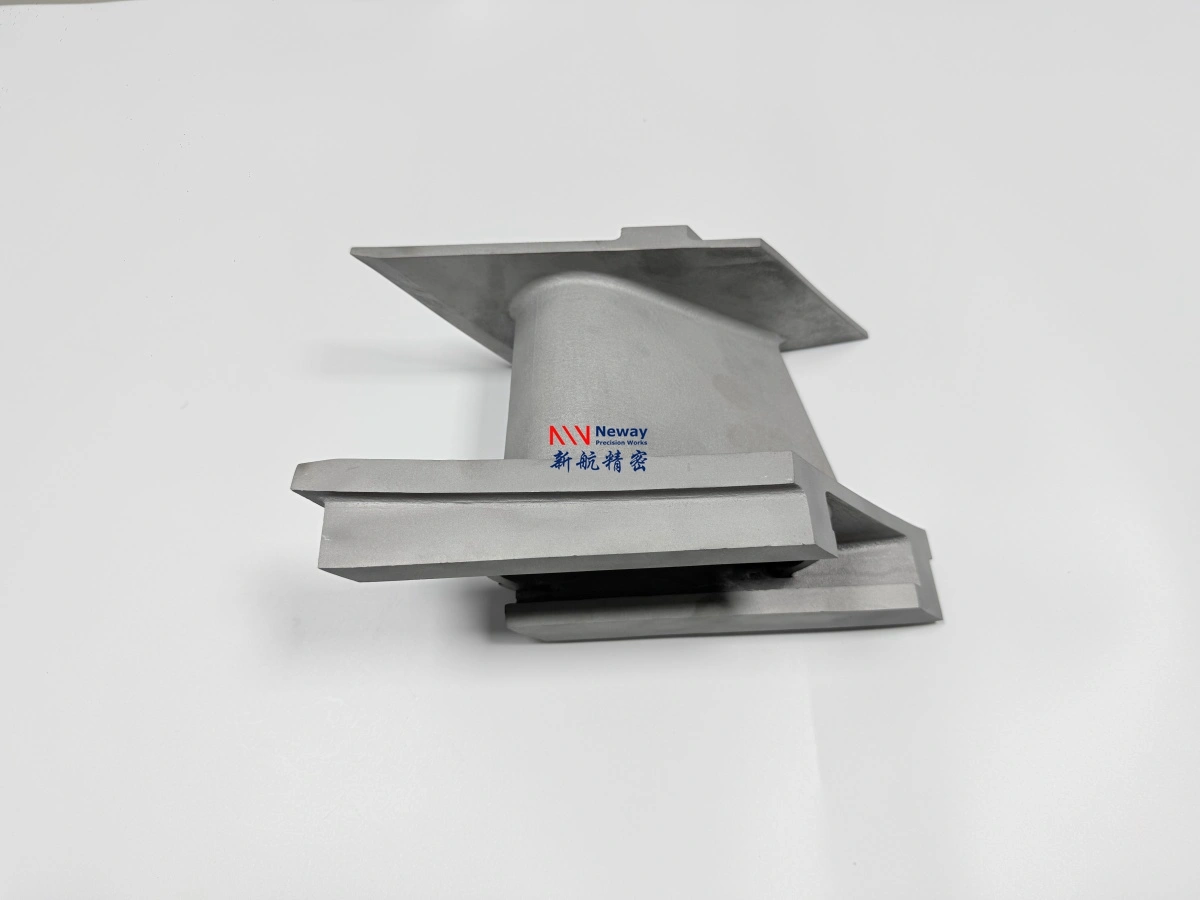
Yes, we provide extensively detailed formal reports that include comprehensive defect statistics, thorough porosity evaluation, and high-resolution CAD deviation color maps. Our reporting methodology adheres to international standards such as ASTM E2737 and ISO 10360, ensuring consistent, reliable documentation for quality assurance and certification purposes across all our additive manufacturing services, including components produced via Powder Bed Fusion and Directed Energy Deposition.
Defect Statistics and Quantitative Analysis
Comprehensive Flaw Documentation
Our reports include detailed statistical analysis of internal defects, categorizing them by type, size, and location. For critical applications in Aerospace and Aviation, we provide defect distribution maps that identify clustering patterns and potential stress concentration regions. The statistical analysis includes volume-based defect quantification, number density calculations, and size distribution histograms, which are particularly crucial for Titanium Alloy components, where defect populations directly influence fatigue performance.
Acceptance Criteria Evaluation
We correlate defect statistics with industry-specific acceptance standards, providing clear pass/fail determinations based on applicable specifications. For Medical and Healthcare implants, this includes evaluation against ASTM F2884 and ISO 13485 requirements. Our reports explicitly identify defects exceeding critical size thresholds and provide risk assessment for their potential impact on component integrity.
Porosity Evaluation and Material Density Analysis
Quantitative Porosity Assessment
Our reports include volumetric porosity percentage calculations, pore size distribution analysis, and morphology classification (spherical, irregular, or lack of fusion voids). For components that have undergone Hot Isostatic Pressing (HIP), we provide before-and-after comparisons that demonstrate the effectiveness of porosity reduction. This is particularly valuable for Superalloy components where material density directly correlates with high-temperature mechanical properties.
Spatial Distribution Mapping
We generate 3D porosity distribution maps that identify regions of elevated void concentration, enabling targeted design improvements. The analysis includes wall-thickness correlation studies to identify potential process parameter optimizations for materials such as stainless steel and Aluminum Alloys manufactured through our additive processes.
CAD Deviation Analysis with Color Mapping
Dimensional Verification
Our reports include comprehensive 3D color maps that graphically represent dimensional deviations between the scanned component and the original CAD model. We employ sophisticated best-fit algorithms to account for permissible geometric variations while identifying significant deviations. This capability is essential for validating complex geometries produced using Material Extrusion and other AM processes.
Tolerance Compliance Verification
The deviation analysis includes quantitative measurements of critical features, clear identification of out-of-tolerance conditions, and direct comparison with design specifications. For Automotive and Consumer Electronics applications, we provide specific analysis of interface features, mounting surfaces, and clearances affected by post-processing such as CNC Machining or Surface Treatment.